
Regime models are the most persuasive charts in retail quant. A band of colour under the price turns red before the 2008 lows, green through 2013, red again in March 2020. It looks like the model saw something. The useful question is narrower: on the day the colour changes, do you know anything about the next two weeks that you did not know the day before.
This week we tested "Expectation Maximization Gaussian Mixture Regime", an open-source TradingView script published on GitHub by ChartsLector and adapted from AlphaNatt's "Machine Learning Gaussian Mixture Model". It is a careful piece of work. It fits a mixture of Gaussians to three features (14-day return scaled by volatility, the ratio of short-term to long-term volatility, and volume relative to its 50-day average), initialises with batch expectation maximisation, then keeps learning online with exponential forgetting. It uses log-sum-exp for numerical stability, floors the variances, and updates parameters only on closed bars. The author labels it educational and makes no performance claim. We are testing the idea, not grading the code.
The desk question: if you had followed the signal with real fills, would you have done better than holding the fund, and better than a version of the signal that knows nothing.
Here's the plan:
- Port the script to Python line for line, with its default settings (3 components, 100-bar memory), and change nothing.
- Run it on 8 liquid ETFs (SPY, QQQ, IWM, DIA, MDY, EFA, EEM, XLK) using dividend-adjusted daily data. The signal is known at the close and traded at the next open, with 3 basis points per unit of turnover and Treasury bill interest on cash.
- Score June 2004 to September 2026, and separately the halves either side of February 2013.
- Compare against three things: buy and hold, a plain 200-day moving average, and a control that is long whenever the close is above the close 14 days earlier.
- Run a placebo. Shift the position series in time by a random amount, 300 times per fund. Each shifted copy spends the same share of days invested, in blocks of the same length, on different dates. If the real signal knows something, few shifted copies should beat it.
- Repeat for 2, 3 and 4 components and for 100 and 250 bars of memory, so the verdict does not rest on one setting.
What the states look like
Start with what the model believes it has found. With three components it sorts every day into the state with the highest probability, and ranks the states by their average momentum. The lowest is drawn as bearish, the highest as bullish.
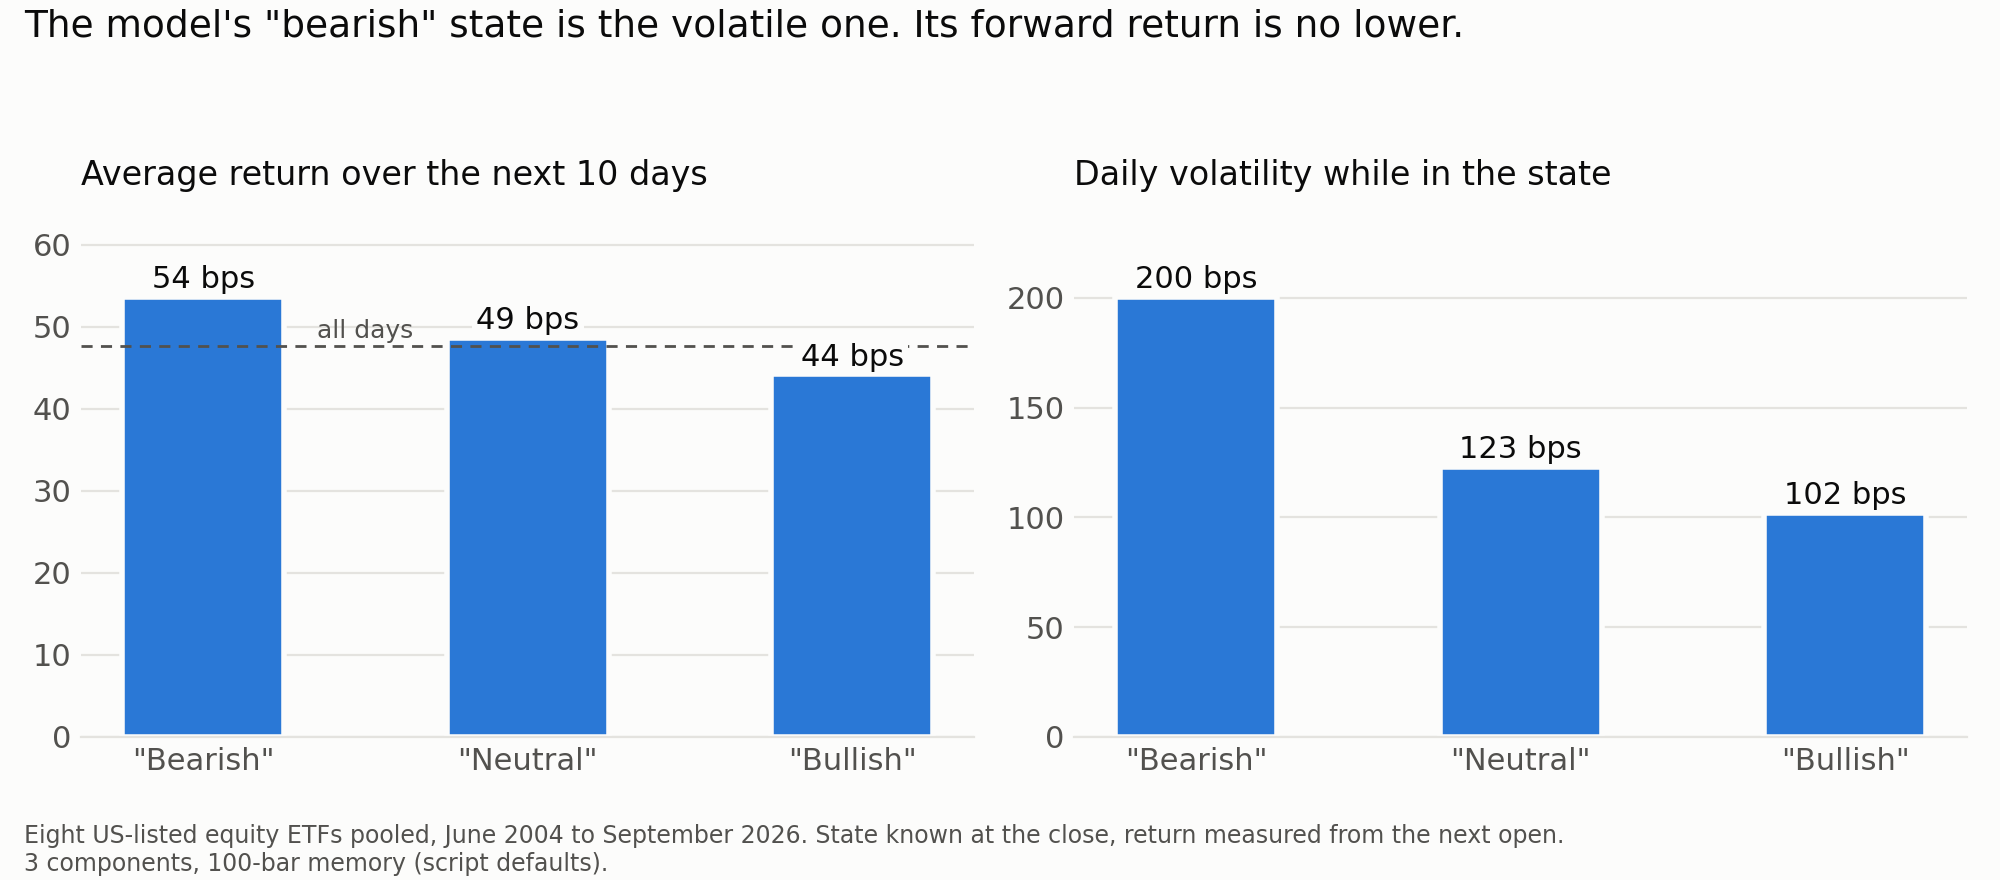
The states are real, in the sense that they are different from each other. Days in the bearish state have daily volatility of 200 basis points. Days in the bullish state have 102. The model has found the oldest regularity in equity markets: volatility clusters, and it is high after prices fall.
What the states do not differ in is what happens next. Across the 8 funds, the 10 days after a bearish reading returned 54 basis points on average, against 44 after a bullish reading and 48 on all days. The share of positive 10-day outcomes was 60.3%, 60.8% and 60.1%. The point estimate has the wrong sign for the label in 6 of 8 funds over 10 days and in 7 of 8 over one day.
We do not want to oversell that. With autocorrelation-consistent standard errors the bearish-minus-bullish gap is indistinguishable from zero in every fund: for SPY it is +21 basis points over 10 days with a 95% interval from -38 to +81. The claim we can support is not that the labels are backwards. It is that they carry no directional information, in either direction, while describing risk quite well.
What happened to the money
| Median of 8 ETFs, June 2004 to September 2026 | CAGR | Max drawdown | Sharpe | Days invested | Position changes per year | Shifted copies that beat it |
|---|---|---|---|---|---|---|
| Buy and hold | 9.9% | -55% | 0.59 | 100% | 0 | |
| 200-day moving average | 7.0% | -25% | 0.60 | 78% | 8 | 15% |
| Close above close 14 days ago | 4.4% | -36% | 0.43 | 62% | 29 | 57% |
| Mixture model, long when oscillator is above zero | 6.0% | -37% | 0.49 | 65% | 15 | 42% |
| Mixture model, long unless the top state is bearish | 7.8% | -40% | 0.58 | 79% | 25 | 21% |
| Mixture model, long only when the top state is bullish | 2.8% | -31% | 0.36 | 39% | 31 | 63% |
The default signal trailed buy and hold in all 8 funds, by between 2.1 and 8.6 percentage points a year. It cut the median drawdown from 55% to 37%, but it did that by being out of the market a third of the time: its Sharpe ratio was lower than buy and hold in 6 of 8 funds, and 42% of randomly shifted copies, which by construction know nothing, produced a higher Sharpe ratio than the real thing. A 200-day moving average, which is one line of code, had a smaller drawdown, a higher return and half the trading.
The reason is visible in the control row. Because the states are ranked by momentum, the oscillator is above zero when recent returns are positive. It held the same position as "close above close 14 days ago" on 80% of days at the median fund, and as high as 85% for SPY. The mixture, the online learning and the volume feature move the other 20%. We measured those days separately, and they helped a little: the model beat the one-line rule by about 1 percentage point a year at the median fund, in 6 of 8 funds, and by a margin distinguishable from zero in 2 of them. It was not enough. Most of the model's position is the one-line rule, the one-line rule fails, and the model still trailed buy and hold in all 8 funds. In this sample 14-day index momentum had no continuation to harvest, which is what the control row shows. A signal that buys strength and sells weakness at that horizon sells after the drop, in the high-volatility state, where the forward return was never lower.
The part that looked like it worked
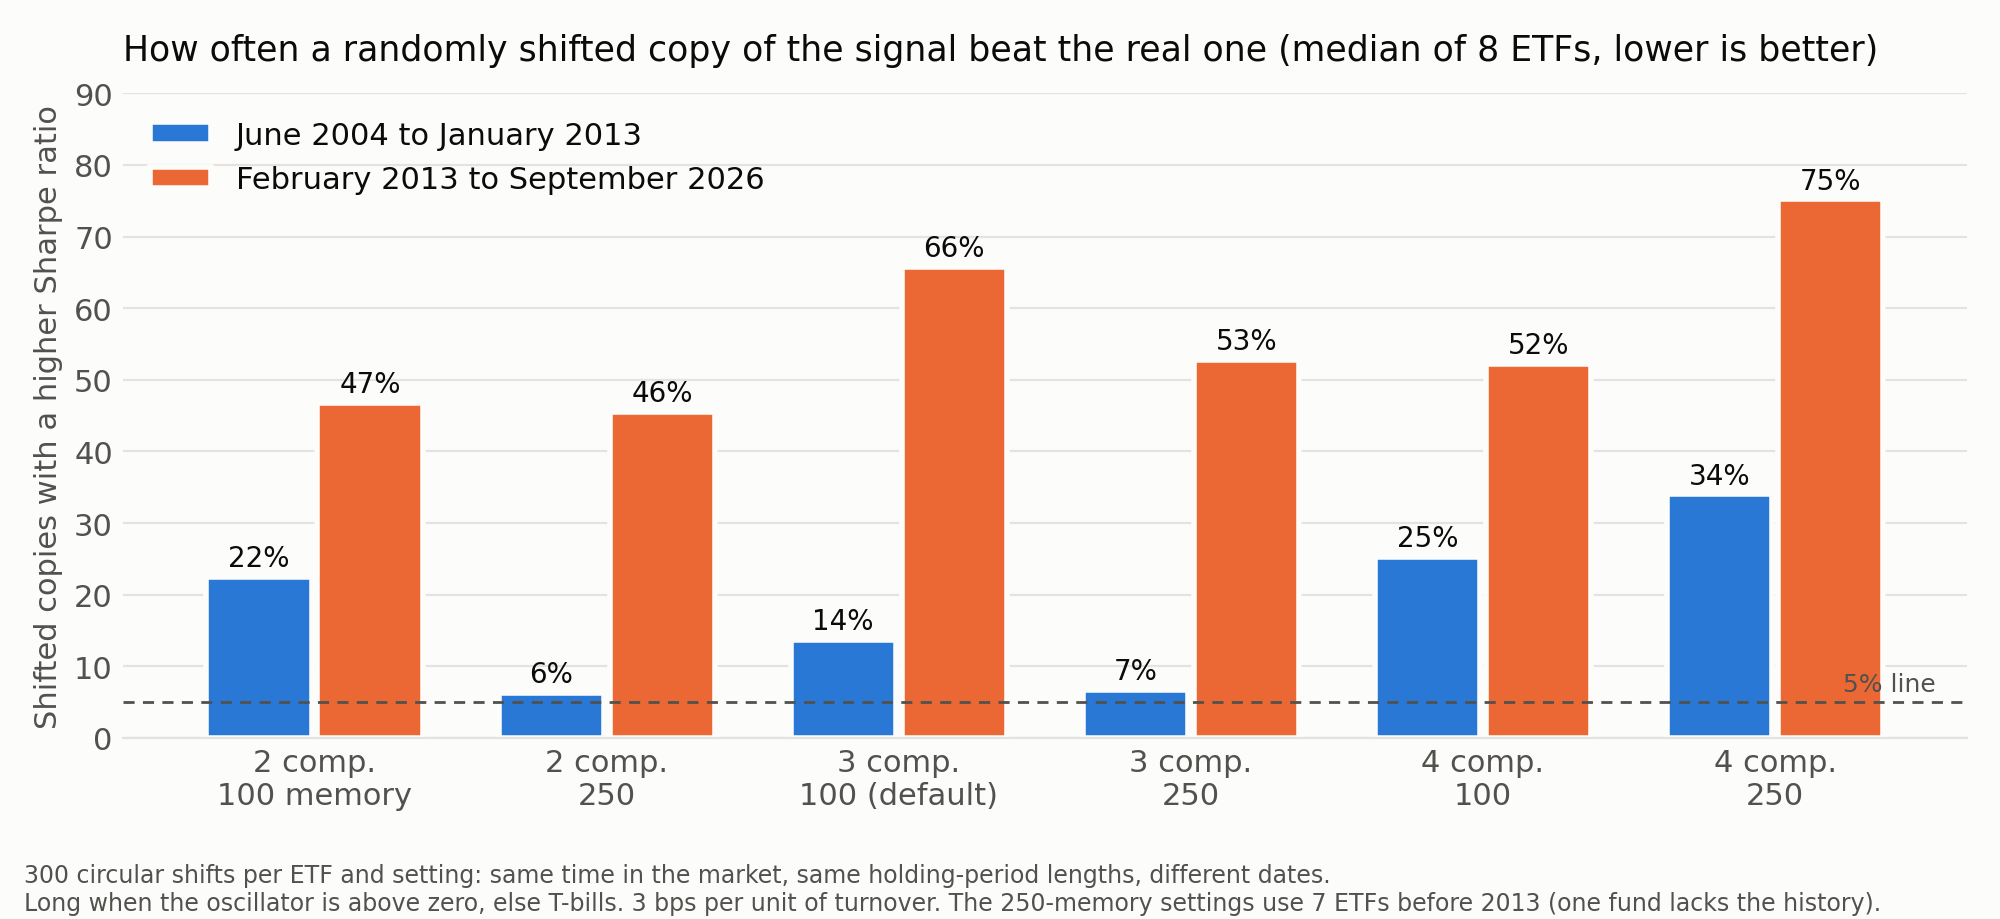
Had we run this test in early 2013, we might have written a different article. From June 2004 to January 2013 two of the six settings sat close to the 5% line, with only 6% and 7% of shifted copies doing better, and they beat buy and hold in roughly half the funds. That window contains 2008, and any rule that reduces exposure when volatility rises looks skilled across 2008.
From February 2013 to September 2026 every setting failed. Between 46% and 75% of shifted copies beat the real signal, which is what a coin flip looks like. We did not test why, and we will not guess. No setting of components or memory changed the verdict.
What we take from it
A clustering model finds structure in the features you give it. Give it momentum, volatility and volume, and it will find volatility regimes, because that is where the structure is. Ranking those clusters by momentum and colouring them red and green is a labelling decision made by the author, not something the model learned, and it is that label, not the statistics, that implies a forecast.
Three checks separate a regime model that describes from one that predicts, and they apply to any such tool:
- Measure forward returns by state, from the next open, with honest standard errors. If the states differ in volatility and not in return, you have a risk gauge. That is useful for sizing. It is not a timing signal.
- Compare against the simplest rule that uses the same information. If a one-line rule holds the same position four days in five, most of the model is that rule, and the remainder has to carry the whole case for the added machinery. Measure it.
- Shift the signal in time and rerun it. If the shifted copies do about as well, the result came from how much time was spent invested, not from when.
Scope: 8 US-listed equity ETFs, daily bars, the script's default features, one fund lacked the history for the 250-bar settings before 2013. Model returns after stated costs, not broker fills. We did not test intraday bars, other asset classes, or the states as a position-sizing input, where a volatility gauge may well earn its keep. The author's repository carries no license, so we have not redistributed the code or our port of it.
Sources: the author's public script and our September 20, 2026 house test on daily data for eight US-listed ETFs.
AI assists curation and drafting. Finance Paper Mill is run and curated by a 30-year hedge fund veteran. Read our research approach.
Free in full