
One chart has travelled further than almost any other in retail quant. Take a stock index. Split every day's return in two: the move from yesterday's close to today's open, and the move from today's open to today's close. Compound each half separately for thirty years. The overnight line goes to the moon. The intraday line goes to zero.
The chart comes from "Strikingly Suspicious Overnight and Intraday Returns" by Bruce Knuteson, who shows the same picture in 20 of 21 national markets and argues that no innocent explanation fits. It circulates with single-stock versions attached: one chip maker up millions of percent overnight and down 99.9% intraday.
The desk question is narrower than the debate about cause. Is the chart right, and is it still true.
One point of credit first. The paper itself says that the divergence in the two US indices stopped in 2008, and it offers its own reading of why. That caveat rarely travels with the chart. What we add is an extension of the decomposition through September 2026, a cut by era in basis points per day, a look at the single stocks since the paper was written, and a generic trading-cost budget.
Here's the plan:
- Rebuild the decomposition from the same public source the paper uses, daily open and close from Yahoo Finance, with dividends added back to the overnight leg on ex-dividend days.
- Cross-check the US series against a second, independent data vendor.
- Run it on SPY, QQQ, IWM and DIA, on 18 non-US markets using the paper's instruments where Yahoo still serves them, and on 27 of the US stocks named in the widely shared chart.
- Report average return in basis points per day, by era, instead of one compounded number. A percentage compounded over 33 years cannot tell you whether an effect ended 15 years ago.
The chart is right
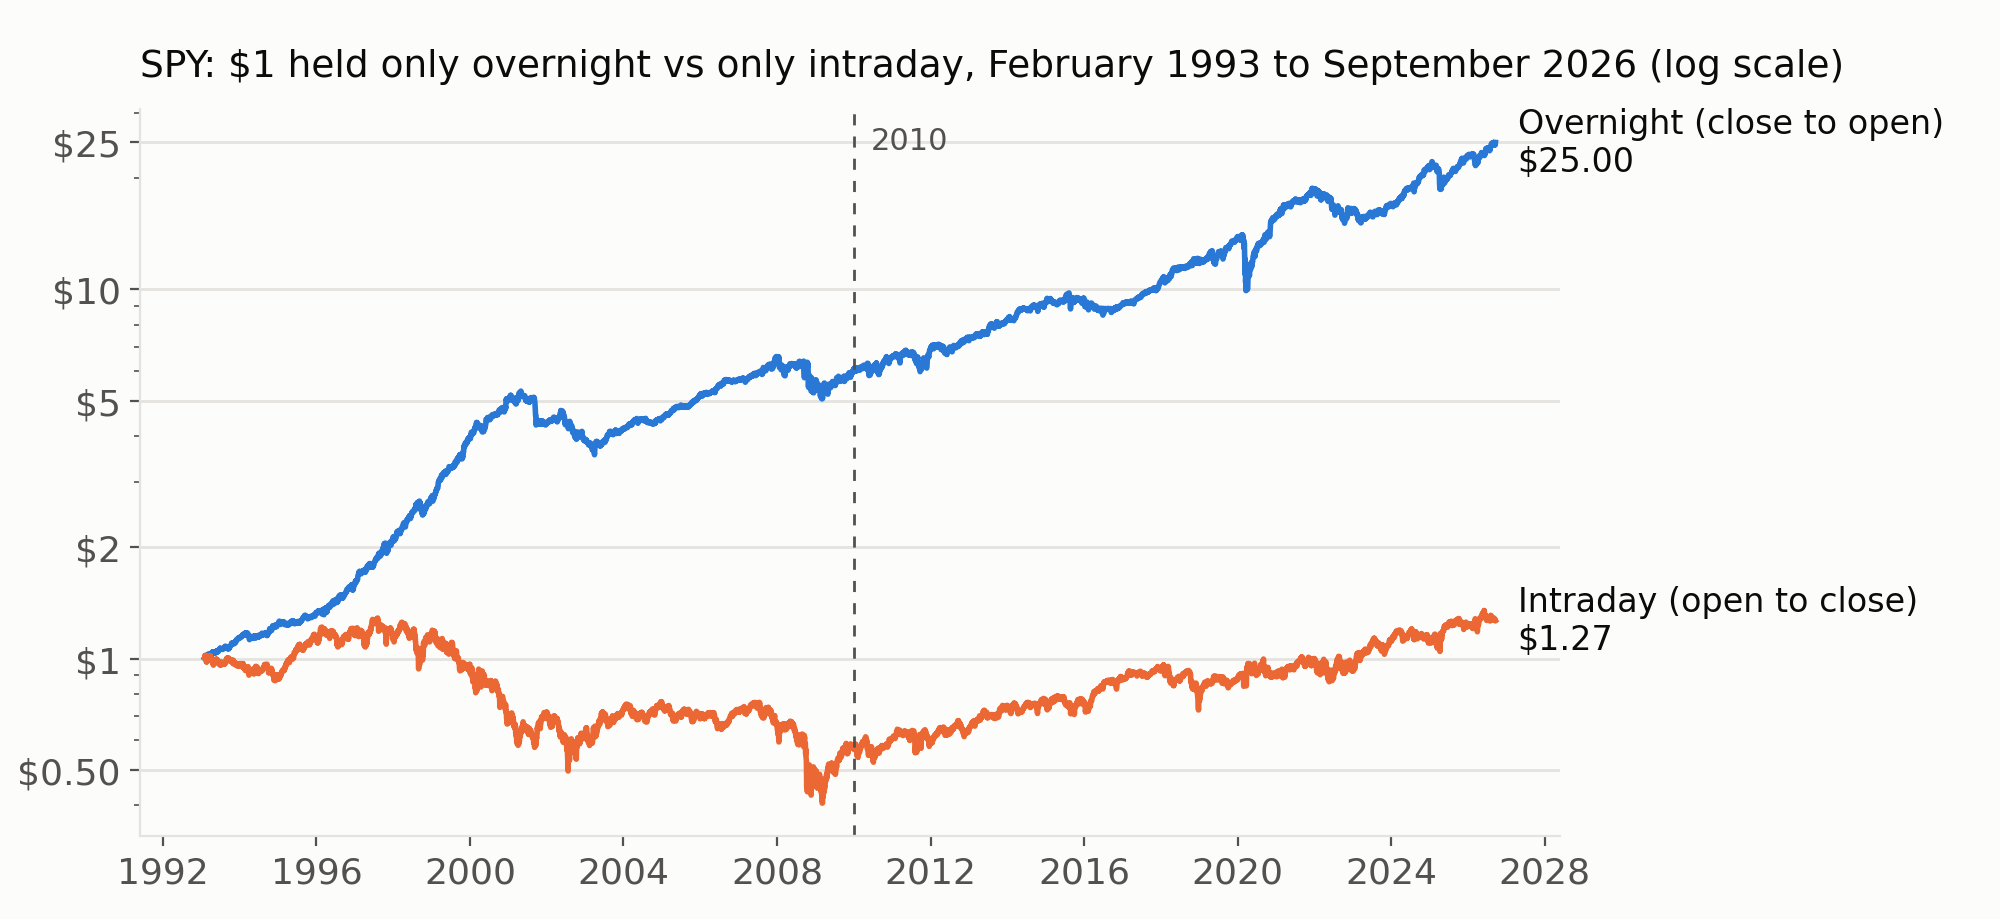
From February 1993 to September 2026, $1 held in SPY only overnight became $25.00. The same $1 held only from open to close became $1.27. Buy and hold, which is the product of the two, became $31.64. The second vendor agrees: on the 5,793 sessions both cover, the average overnight return is 3.38 basis points a day in one and 3.35 in the other, with a correlation of 0.995.
Abroad it is the same picture. In 17 of 18 non-US series the overnight leg beat the intraday leg over the full sample, and in most of them the intraday leg lost money outright. China is the exception, inverted, as the paper says. The single-stock numbers also reproduce. One semiconductor name compounds to +19,000,000% overnight and -99.9% intraday from 1990.
So the data are real, and anyone can check them with a free data source and twenty lines of code. That part of the story is not in dispute.
What the compounding hides
Two things change when the same data are cut by era.
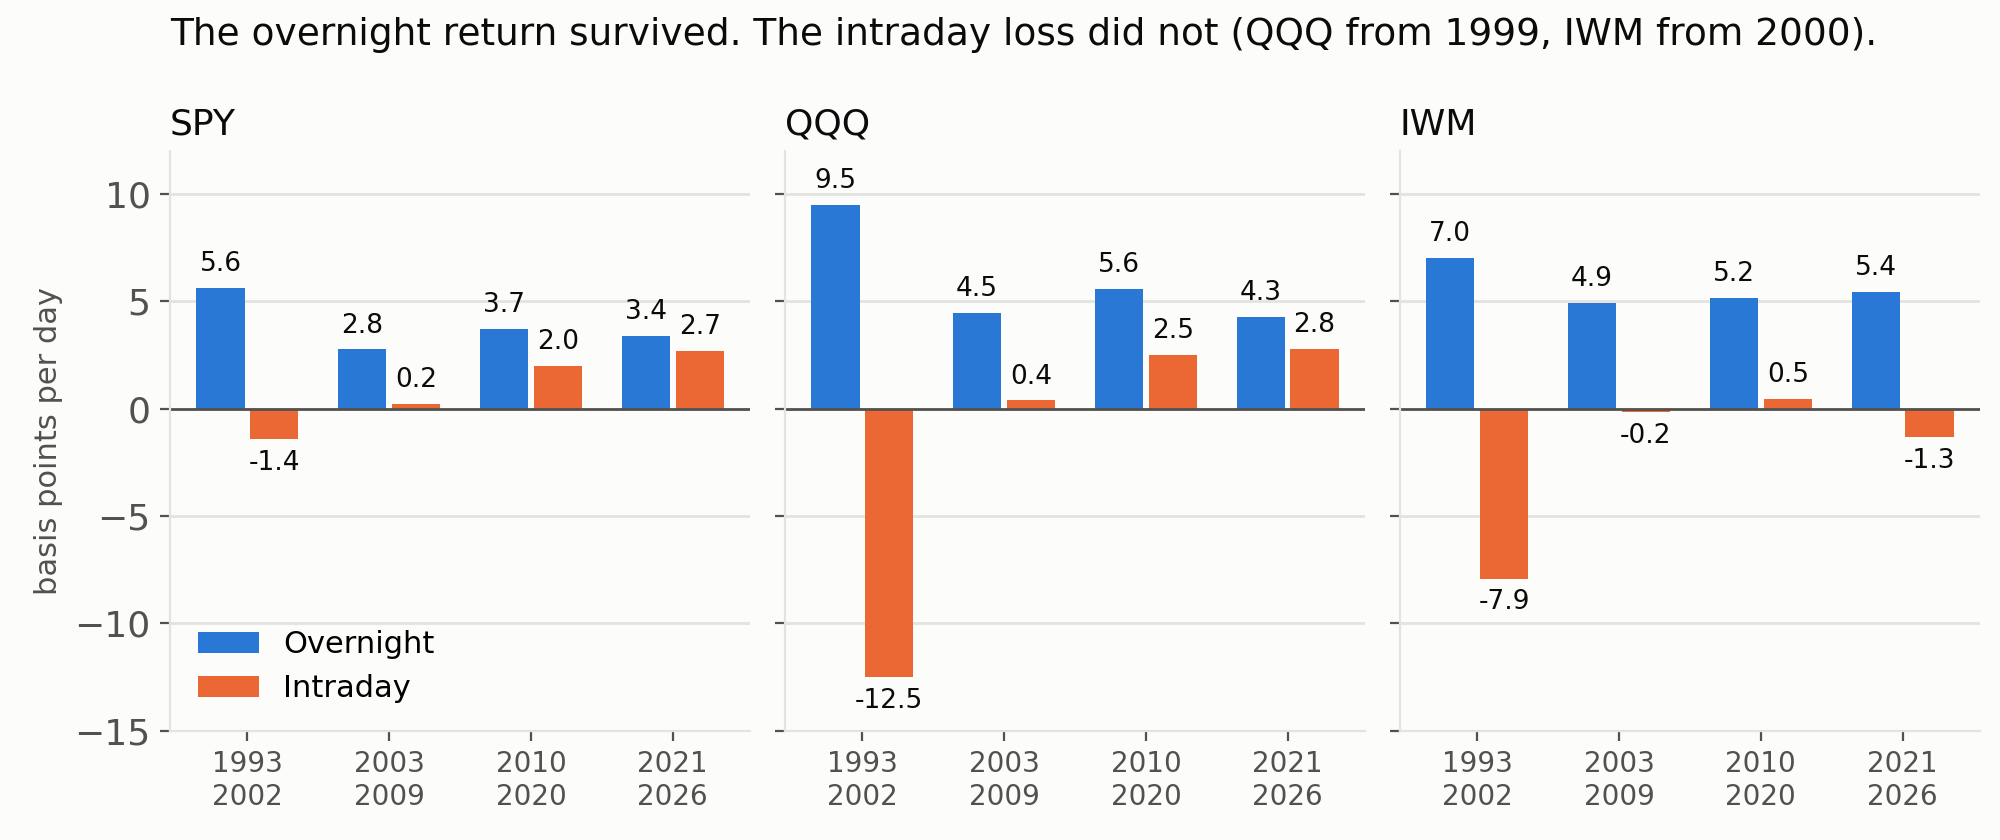
First, the effect is small per day. SPY's overnight return averages 4.0 basis points a day over the full sample. It was 5.6 from 1993 to 2002, then 2.8, 3.7 and 3.4 in the three periods since. The enormous cumulative percentages are what 3 to 5 basis points look like after 8,000 compounding periods. The single-stock figures in the millions of percent are 15 to 17 basis points a night.
Second, in the US the intraday loss stopped. SPY's intraday leg averaged -1.4 basis points a day from 1993 to 2002, then +0.2, +2.0 and +2.7. A dollar held only intraday fell to $0.61 by the end of 2002 and to under $0.50 in early 2009. From January 2010 to September 2026 it grew to $2.23. QQQ is the same story with bigger numbers: -12.5 basis points a day from 1999 to 2002, then +0.4, +2.5 and +2.8. Of the four US funds only IWM still has a flat to negative day session (-1.3 from 2021 to 2026).
A caution on our own chart. In SPY the intraday average was never statistically distinguishable from zero in any of the four eras, negative or positive (t-statistics of -0.7, 0.1, 1.4 and 1.2). What is reliably different from zero is the overnight leg (t of 5.6 over the full sample). The accurate summary of the US evidence is that overnight returns have been persistently positive and the day session has earned roughly nothing over 33 years, negative early and positive late.
Outside the US the original pattern has more life in it. From 2021 to 2026 the intraday leg was still negative in 6 of the 18 non-US series: the two Indian indices, Korea, Hong Kong, and the Australian and Singaporean index funds. The overnight leg remained more than two standard errors above zero in 11 of them. In Europe, Japan, Canada, Brazil and Mexico the intraday leg has turned positive, as it has in the US.
The famous stocks were chosen
The shared chart shows 50 stocks selected by its author. We could read 27 of the tickers. In six of them (Accenture, Barclays, Bio-Rad, Cadence, Nordson and NVR) the intraday leg outperformed the overnight leg over the full sample, and in five of the six the overnight leg lost money outright. The chart includes them, to its credit, but the versions that go viral are cropped to the two or three most extreme names.
Among the names with the largest overnight returns, the per-night figure has faded in several. The paper names Apple as a stock where the divergence continued after 2008, and through 2020 it did: 10.5 basis points a night against 2.1 intraday from 2010 to 2020. From 2021 to 2026 it reversed, to -2.8 overnight and +11.1 intraday. Gilead went from 30.4 in its first decade to -1.1. Others have not faded at all: the two chip makers at the top of the chart still earn 14 to 18 basis points a night.
Can you trade it
Holding SPY only overnight means one round trip every session. From 2010 to 2026 that position returned 8.9% a year before costs, with lower volatility than the day session (10.9% against 12.9% annualised). The average night is 3.6 basis points, so that is the whole budget for trading costs. At half a basis point per side the annual return falls to 6.1%. At one basis point per side it is 3.5%. At two it is negative. Buy and hold over the same period needs no trades at all and also collects the day session, which since 2010 has been worth having.
What we take from it
- The decomposition is real, reproducible and robust to the data vendor. Overnight returns in US index funds have been positive in every era we cut, and that is the part of the finding that has held up out of sample since the paper's data end.
- "The market loses money during the day" was a description of 1993 to 2009. It has not been true of SPY, QQQ or DIA since 2010, which extends by 16 years the break the paper dated to 2008. Since the paper was written the same thing has happened in Europe, Japan, Canada, Brazil and Mexico, and has not happened in India or Korea. Any explanation of the pattern, the paper's or anyone else's, has to fit that map.
- A cumulative log-scale chart is the wrong instrument for the question most readers bring to it, which is whether the effect exists now. Basis points per day by era answers that. It is a less exciting picture.
Scope: Yahoo Finance daily open and close, dividends added to the overnight leg, no other adjustment; one Norwegian fund in the paper is no longer served and was dropped, and one Italian fund was replaced with a close substitute. Index "open" values on Yahoo are partly stale for a few markets (Israel and the Singapore fund most of all), and for US stocks before 2000; stale days were excluded from the era figures where they exceed a fifth of the sample. We did not test the paper's explanation for the pattern and take no position on it. Returns are before costs unless stated.
Sources: the author's public paper and our September 21, 2026 house test on daily open and close data for US index funds, 18 non-US markets and 27 US stocks.
AI assists curation and drafting. Finance Paper Mill is run and curated by a 30-year hedge fund veteran. Read our research approach.
Free in full